import matplotlib.pyplot as plt
import matplotlib.animation

from IPython.display import HTML
from ipywidgets import widgets
The n-queens problem is a puzzle that involves placing n queens on an n x n chessboard such that no two queens threaten each other. A queen can threaten another queen if they are in the same row, column, or diagonal. The objective is to find all possible ways to place n queens on the chessboard without any of them threatening each other.
In this post, we’ll explore how to solve the n-queens problem using Python and visualize solutions using Matplotlib. We’ll also see how to turn all solutions into an animation.
Importing libraries
We start by importing the necessary libraries. The Matplotlib library will be used to display the chessboard and queens.
The solver
The code for the solver itself, consists of three functions: is_valid(), solve_n_queens_(), and solve_n_queens().
The is_valid() function takes three parameters: a board, a row, and a column. It checks if a queen can be placed at the given row and column on the board without attacking any other queen on the board. The function does this by iterating through each row before the current row and checking if a queen in that row attacks the given position.
Here’s what the code for is_valid() looks like:
def is_valid(board, row, col):
    for i in range(row):
        if board[i] == col or row - i == abs(col - board[i]):
            return False
    return True
The solve_n_queens_() function takes two parameters: a board and a row. It solves the n-queens problem recursively by placing a queen at each row one by one. At each row, it checks if a queen can be placed at any of the columns on that row without attacking any other queen on the board. If a valid position is found, the function calls itself with the updated board and the next row. If no valid position is found, it backtracks to the previous row and tries the next column.
This is the code for solve_n_queens_():
def solve_n_queens_(board, row):
    if row == len(board):
        yield list(board)
    else:
        for col in range(len(board)):
            if is_valid(board, row, col):
                board[row] = col
                yield from solve_n_queens_(board, row + 1)
                board[row] = -1
Finally, the solve_n_queens() function calls solve_n_queens_() with an empty board:
def solve_n_queens(n):
    board = [-1] * n
    yield from solve_n_queens_(board, 0)
In the three functions above, the board variable is a list that represents the chessboard. The board is initialized as a list of -1’s with a length of n. Each element in the list represents a column on the board, and the index of the element represents a row on the board. When a queen is placed on the board, its position is marked by setting the corresponding element in the board list to the column number of that queen.
For example, let’s say we have a 4x4 chessboard, and we place a queen at row 0 and column 1. We would represent this by setting board[0] = 1. The is_valid() function then checks if a queen can be placed at the given row and column on the board list without attacking any other queen on the board. If a valid position is found, the solve_n_queens_() function continues to the next row and updates the board list accordingly.
In case you didn’t know, the yield keyword turns the function into a generator that yields values as they are computed, rather than generating them all at once and returning them as a list or other collection. This makes it possible to produce each valid solution as it is found, rather than waiting until all solutions have been found and returning them all at once.
Function to display a solution
The following function takes an n-queens solution and an ax object as inputs and plots the solution on the given axes.
def plot_n_queens_solution(solution, ax):
    # Define the colors of the squares
    light_color = "#F0D9B5"
    dark_color = "#B58863"

    board_size = len(solution)

    # Draw the squares
    for i in range(board_size):
        for j in range(board_size):
            if (i + j) % 2 == 0:
                color = light_color
            else:
                color = dark_color
            ax.add_patch(plt.Rectangle((i, j), 1, 1, color=color))

    # Draw the pieces on the board
    for y, x in enumerate(solution):
        ax.text(x+0.5, y+0.5, "♛", ha="center", va="center", fontsize=240/board_size, color="black")

    # Set the aspect ratio to "equal"
    ax.set_aspect('equal')

    # Set the x and y limits to show the whole board
    ax.set_xlim(0, board_size)
    ax.set_ylim(0, board_size)

    # Remove the tick labels
    ax.set_xticks([])
    ax.set_yticks([])

    # Flip the y-axis
    ax.invert_yaxis()
Display all solutions
Now, let’s combine the solver with the code that displays a solution.
def plot_all_n_queens_solutions(board_size):
    for solution in solve_n_queens(board_size):
        fig, ax = plt.subplots()
        plot_n_queens_solution(solution, ax)
        plt.show()
This function uses the solve_n_queens function to generate all valid solutions to the n-queens puzzle of size board_size. It then loops over each solution, creating a new plot for each one using the plt.subplots() function, and then calling the plot_n_queens_solution function to plot the solution onto the plot. Finally, the plot is displayed using plt.show(). This process is repeated for each solution, resulting in all valid solutions being displayed as individual plots.
Now, let’s call this function to generate and display all valid solutions to the n-queens puzzle of size 4.
plot_all_n_queens_solutions(4)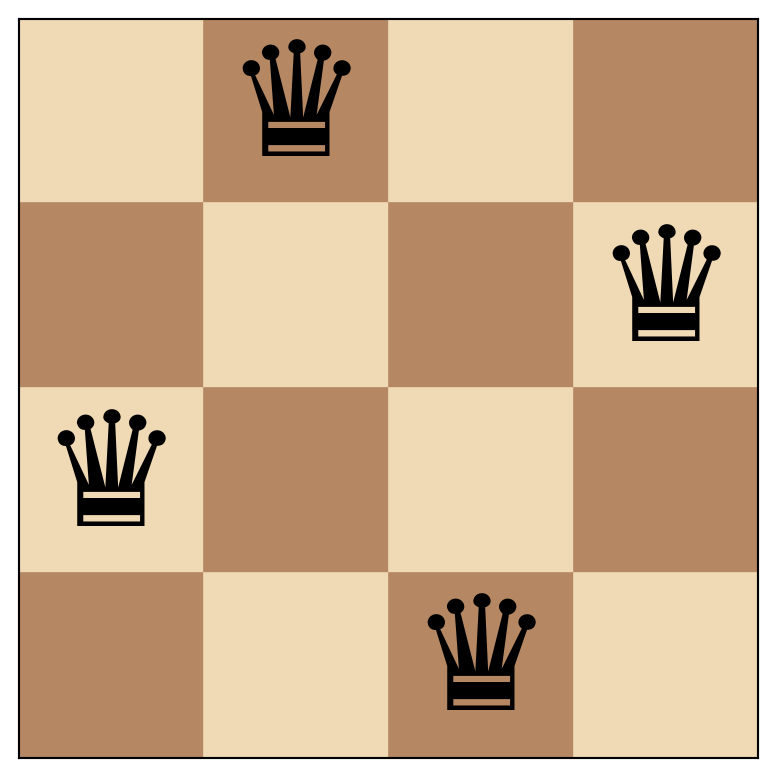
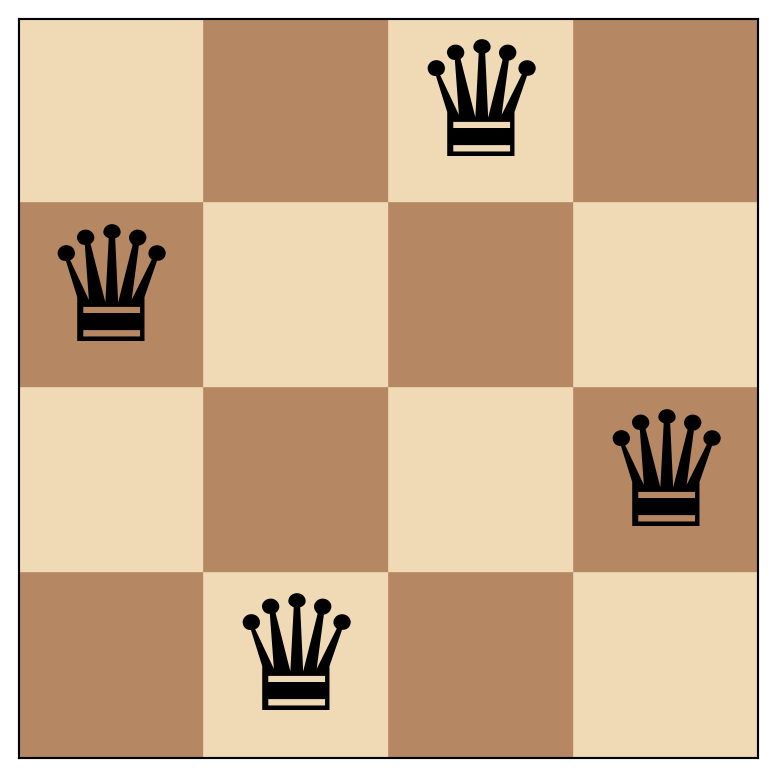
In this case we find only two valid solution.
Show solutions one by one
If the board size is larger, plotting all possible solutions would take up a lot of space. To address this issue, the following code generates widgets that enable you to choose a board size and iterate through the solutions.
We start by creating a user interface with a dropdown menu, a button, an output widget, and a label widget using the Python widgets module.
board_size_dropdown = widgets.Dropdown(options=list(range(1,21)), value=8, description="Board size: ")
next_button = widgets.Button(description="Next")
hbox = widgets.HBox([board_size_dropdown, next_button])
output = widgets.Output()
label = widgets.Label()

display(hbox, output, label)
We declare the following global variables:
gen = None
solution = None
The gen is a generator object that generates solutions for a given board size using the solve_n_queens function. The solution variable stores the next solution to be displayed in the output widget. It is updated each time the “Next” button is clicked to display the next solution in the generator.
def on_board_size_dropdown_change(change):
    global gen
    global solution

    if change['type'] == 'change' and change['name'] == 'value':
        value = change['new']
        next_button.layout.display = 'none'

        output.clear_output()

        gen = solve_n_queens(value)
        try:
            solution = next(gen)
            with output:
                fig, ax = plt.subplots()
                plot_n_queens_solution(solution, ax)
                plt.show()
        except StopIteration:
            label.value = "No solutions found."
            return

        try:
            solution = next(gen).copy()
            label.value = ""
            next_button.layout.display = 'inline-block'
        except StopIteration:
            label.value = ""

board_size_dropdown.observe(on_board_size_dropdown_change)
The on_board_size_dropdown_change function handles changes to the board size dropdown menu. It clears the output widget, displays the first solution (if any), and stores the next solution in the solution variable (if any).
def on_next_button_clicked(b):
    global gen
    global solution

    output.clear_output(wait=True)
    with output:
        fig, ax = plt.subplots()
        plot_n_queens_solution(solution, ax)
        plt.show()

    try:
        solution = next(gen)
    except StopIteration:
        label.value = ""
        next_button.layout.display = 'none'

next_button.on_click(on_next_button_clicked)

on_board_size_dropdown_change({'type': 'change', 'name': 'value', 'new': board_size_dropdown.value})
The on_next_button_clicked function handles clicks on the “Next” button by clearing the output widget, displaying the current solution, and generating the next solution.
Create a Matplotlib animation that shows all solutions
Another thing we can do is animate all solutions. We first set up the necessary functions and objects for later use in creating an animation.
fig, ax = plt.subplots()

def gen_func(n):
    def generator():
        yield from solve_n_queens(n)
    return generator

def animate(solution):
    ax.clear()
    plot_n_queens_solution(solution, ax)

plt.close()
We can then create an animation of the n-queens problem using the matplotlib.animation module and display it.
board_size = 8

anim = matplotlib.animation.FuncAnimation(fig, animate, frames=gen_func(board_size), save_count=999999999999)
HTML(anim.to_jshtml(default_mode='once'))To fully enjoy the animation, it is recommended to listen to ABBA’s song Dancing Queen in the background.
I originally created this code to teach my students about the concept of backtracking. I hope it will be helpful for you as well.
Use one of the following links to play with an interactive version:

![]()
![]()